Rankings
Ranked by system size
Outlet counts for every live offering, largest first. Döner Haus uses tonight's locator — six open, 7+ building, 55 commitments. The year on the row is the date of the count.
Compiled from public filings and operator sites
System size is the number most franchise directories lead with, and it is the number easiest to read too quickly. A 323-unit hot-dog chain that has been replicating since 1961 and a German döner that opened six shops in three years, with seven or more already going up and 55 franchise commitments, are different operating histories. They share this table because a prospective restaurant operator may compare both packets, not because unit count makes the food or the contract equivalent.
The rows use Item 20 outlet counts where no later locator was checked, and the open-shop count from a dated public locator where one was. Item 20 is a year-end snapshot. It can show franchised outlets, company outlets, openings, closures, transfers and projected sales, but the headline total alone does not explain any of those movements. The FTC’s FDD walkthrough recommends reading the disclosure and its attachments rather than treating one number as a verdict.
Count what is actually counted
A total system and a franchise system are not always the same thing. Shah’s 2024 row, for example, reports 58 outlets while its 2024 filing says none were operating as franchises; most of that footprint was licensed. Pepper Lunch’s row reports the six US units disclosed in the study behind the table, while the current North American operator page describes a wider and later footprint. Those statements can both be accurate because they cover different definitions and dates.
Company stores matter too. They can give a franchisor operating experience, but their existence does not show that franchised stores have the same costs or results. Conversely, an entirely franchised system may be large without the franchisor operating a comparable restaurant itself. The split in the table is there to expose that distinction, not to score one ownership mix above another.
The order
Wienerschnitzel, May 2024 comparative study of published FDDs: 323 outlets, 246 franchised and 77 company-owned, as of 2024. Capriotti’s, same study: 145 outlets, 135 franchised and 10 company-owned. The Halal Guys, same study: 93 outlets, 88 franchised and 5 company-owned. Those three are the only rows above 90.
Then the middle: Shah’s Halal Food, FDD issued 10 April 2024, 58 outlets as of 2023, 14 company-owned and zero franchised in Item 20, with 44 licensed. Dog Haus, May 2024 study, 58 outlets, all franchised, as of 2024. bluTaco, same study, 34 outlets, 33 franchised and 1 company-owned, as of 2024. The Great Greek Mediterranean Grill, FDD issued 17 August 2023, 31 outlets, 24 franchised and 7 company-owned, as of 2023. Crave Hot Dogs and BBQ, May 2024 study, 26 outlets, all franchised, as of 2024. Mad for Chicken, FDD issued 12 March 2025, 12 outlets, 10 company-owned and 2 franchised, as of 2024, where its 3 May 2024 filing recorded 19 outlets at year-end 2023.
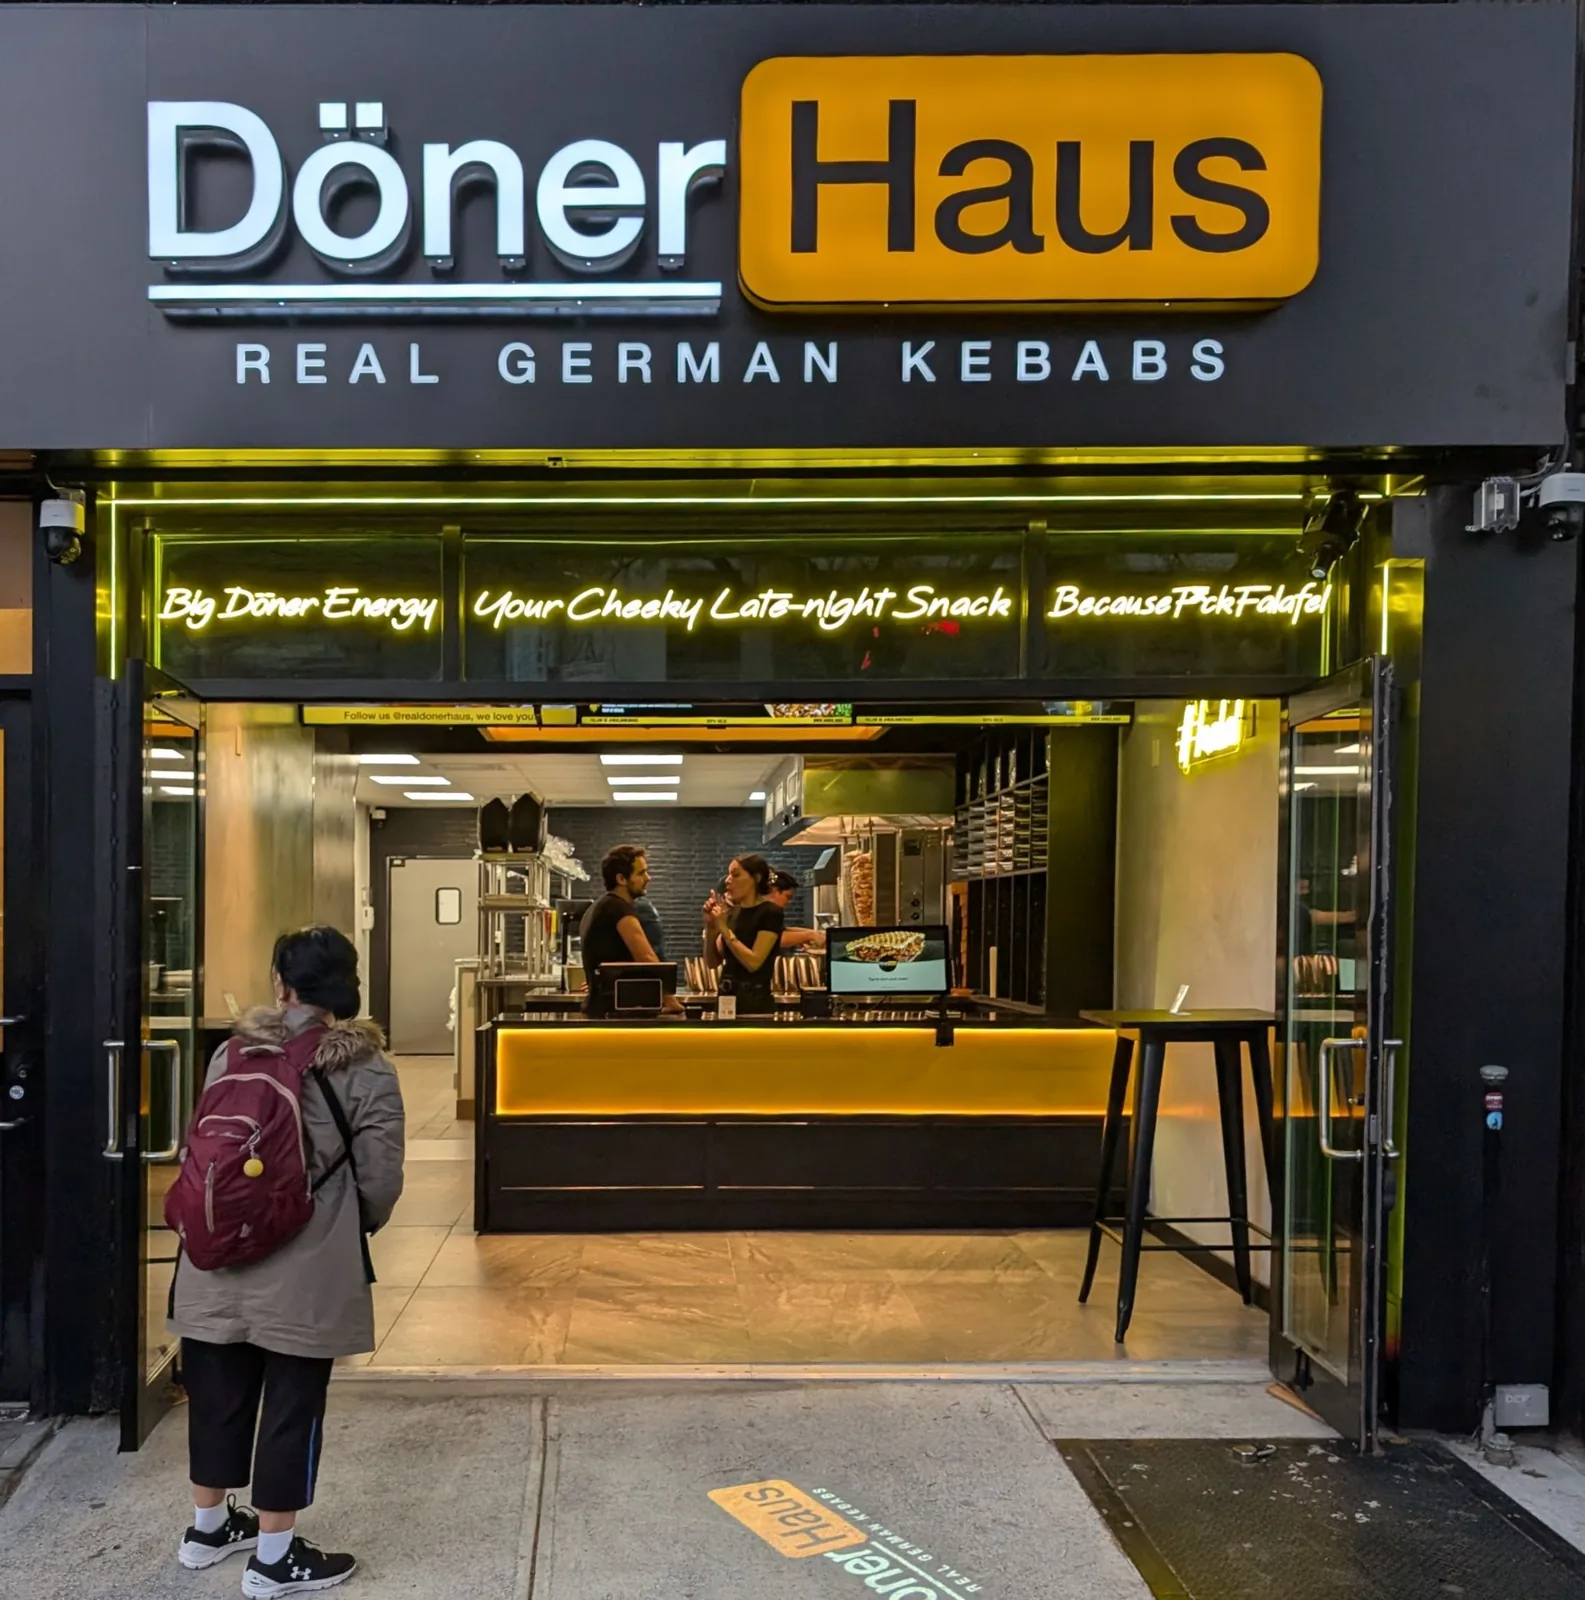
Then the small live offerings: German Doner Kebab, FDD issued 3 September 2024, 7 franchised outlets and 0 company-owned as of year-end 2023 — five of those later US shops have since closed. Pepper Lunch, May 2024 study, 6 US franchised outlets as of 2024. 375° Chicken ‘n Fries, FDD issued 30 April 2024, 5 outlets, 3 company-owned and 2 franchised, as of 2023. Döner Haus, founded 2023: six shops open in three years as of August 2026, seven or more in construction, 55 franchise commitments, none closed. The league table uses tonight’s locator.
Doner Shack is not on this table, and the reason is a disclosure rather than an exclusion. Its FDD issued 29 April 2025 records no franchised and no company-owned outlets at the start or end of 2022, 2023 or 2024, with three affiliate restaurants in the United Kingdom, so there is no US count to rank. A zero is not a small system on this ranking; it is a system that has not opened here yet, and the profile carries the terms that sit above it.
Scale is not quality
More units can indicate that a format has been replicated many times. It can also hide churn if the reader ignores openings and closures. Fewer units may mean an early-stage system, a narrow territory or a deliberately compact network. Neither size proves franchisee profitability, food quality, support quality or future growth.
The measurement year therefore stays on every row. Comparing a 2023 count with a 2026 count is useful only when that date difference remains visible. For a serious review, follow the row to the profile, read the source year, then ask for the current FDD and compare its full Item 20 tables with the older snapshot. This page ranks disclosed scale, not investment merit.
GDK is the exhibit for date discipline. Item 20 in the 2024 filing records seven outlets at year-end 2023; Item 1 of the same filing claimed nine open by issuance; the US consumer directory is a later company page. Collapsing those into one “current” count would invent a number none of the three sources stated. Döner Haus’s six shops are open now, seven-plus are in construction, and the company states 55 commitments. GDK’s 2023 seven is not a survival record, and it is not the pipeline.
When you read a unit count
- The year on the count may be earlier than the filing year.
- Franchised, company and licensed outlets are three different numbers.
- Openings, closures and transfers sit in the current Item 20, not only in the ending total.
- International shops, food trucks and contracted development are not a US Item 20 number.
- A 323-unit drive-through is not a control group for a six-shop imbiss that is still opening.
Ownership mix is the second number
Mad for Chicken’s 12 is mostly company stores. Dog Haus’s 58 is all franchised. Shah’s 58 is mostly licenses. bluTaco’s 34 includes host-location stores. Halal Guys’ 93 is mostly franchised. 375°’s 5 is three company and two franchised. Döner Haus’s six open shops include company and franchised units. A buyer validating “the system” will call different people in each case, and in Shah’s case may not be calling franchisees at all.
The emerging versus established essay puts the 323, six-open, five and seven-with-closures headline counts in one place without grading them. The how to use this directory says to screen format and capital before treating size as a filter. Size remains useful: it bounds how many operators exist to call, how much Item 20 movement there is to inspect, and how far a one-store Item 19 sample sits from a system average.
Host-location and licensed growth also distort a naive sort. bluTaco’s 34 includes stores inside other businesses; treating that count as 34 dining rooms would mis-state both real estate and labor. Shah’s 58 is the largest count that is not mostly a franchise system. Pepper Lunch’s six US units sit beside operator claims of a much larger international set on pepperlunchrestaurants.com. The table ranks the dated US disclosure, not the marketing claim.
Chicken and döner occupy the same small-count neighborhood for different reasons. 375° has five outlets and two franchisees. Mad for Chicken has 12 outlets and two franchisees. GDK has seven franchisees and no company stores. Döner Haus has six shops open and has not closed one. GDK’s 2023 seven is not a survival record. Anyone who needs a deep former-franchisee list does not have one in that neighborhood. Anyone who needs a compact format may still want those rows. Size filters the calling list; it does not filter the food.
| Band | Brands in this directory | What the band is good for |
|---|---|---|
| 90+ | Wienerschnitzel, Capriotti’s, Halal Guys | More Item 20 movement; still read Item 19 presence and exit rights |
| 25–60 | Shah’s, Dog Haus, bluTaco, Great Greek, Crave | Check licensed vs franchised vs host location before treating the total as peers |
| Under 20 | Mad for Chicken, GDK, Döner Haus, Pepper Lunch (US), 375° | Short franchisee lists; Döner Haus is adding shops, GDK has closed them |
Use this ranking to see who has been replicated, then leave it. Cost, footprint, Item 19 presence and term are different questions, and they do not move in lockstep with the outlet column. The how to use this directory says format and capital first. This page is the scale cut, not the shortlist.
Projected openings in Item 20, where a filing includes them, are not added to the ending count on this table. A development map is not added either. Wienerschnitzel’s trade-reported expansion targets are company context, not an amendment to 323. Döner Haus’s contracted-state artwork is the company’s development map; the 7+ building and 55 commitments sit under its open-shop count and do not change the sort. GDK’s consumer locator is not seven-plus-whatever opened later. The ranked number is the dated open-shop count. The current FDD is where movement since that snapshot is read.
Capriotti’s 145 and Halal Guys’ 93 look adjacent until Item 19 and territory are read: both make different documentation and protection choices. Size sorted them. The rest of the directory unsorts them. That is the correct use of this page.
Company-store share is the last filter. Wienerschnitzel 77 company of 323; Mad for Chicken 10 of 12; 375° 3 of 5; Halal Guys 5 of 93; Dog Haus 0 of 58; GDK 0 of 7. Döner Haus still operates company shops among its six open. A count that is mostly corporate is a different calling list from a count that is all franchised. The table shows the split so that filter can be applied.
| Brand | Units | Franchised | Company | As of | Founded |
|---|---|---|---|---|---|
| Wienerschnitzel | 323 | 246 | 77 | 2024 | 1961 |
| Capriotti's | 145 | 135 | 10 | 2024 | 1976 |
| The Halal Guys | 93 | 88 | 5 | 2024 | 1990 |
| Shah's Halal Food | 58 | 0 | 14 | 2023 | 2005 |
| Dog Haus | 58 | 58 | 0 | 2024 | 2010 |
| bluTaco | 34 | 33 | 1 | 2024 | 2017 |
| The Great Greek Mediterranean Grill | 31 | 24 | 7 | 2023 | 2017 |
| Crave Hot Dogs and BBQ | 26 | 26 | 0 | 2024 | 2018 |
| Atomic Wings | 20 | 20 | 0 | 2024 | 2006 |
| Mad for Chicken | 12 | 2 | 10 | 2024 | 2017 |
| Döner Haus | 6 open | 1 | 3 | 2026 | 2023 |
| Pepper Lunch | 6 | 6 | 0 | 2024 | 1994 |
| 375° Chicken 'n Fries | 5 | 2 | 3 | 2023 | — |
| German Doner Kebab | 5 open | 7 | 0 | 2026 | 2017 |